Performance analysis
Depending on the size and location of your pharmacy will greatly influence both which stock you keep, and the costs involved. Understanding how to measure performance of your stock is key to keeping inventory that is relevant to your customers, but that also lends itself towards greater profits for the pharmacy.
Smaller pharmacies struggle with a higher relative cost inventory due to poorer bulk buys, larger shipping fees (per item) and longer stock holding times. Additionally a proportion of their stock is more or less directed by the requirements of the regular customers, which means the pharmacy may need to keep lines which have poorer markups and produce less profit. Larger pharmacies struggle with shelving large quantities of disparate lines. In both instances, the analysis of the problem is largely the same, in that stock items which are not performing cost the pharmacy shelf space and therefore money. If they never sell it is a complete loss for the pharmacy.
So, by checking on low performing stock, we; 1. Increase profits by not reordering items which will not perform, 2. Improve customer satisfaction by keeping store stock relevant to the needs of the customers, 3. Help to keep out-of-date stock off of the shelves.
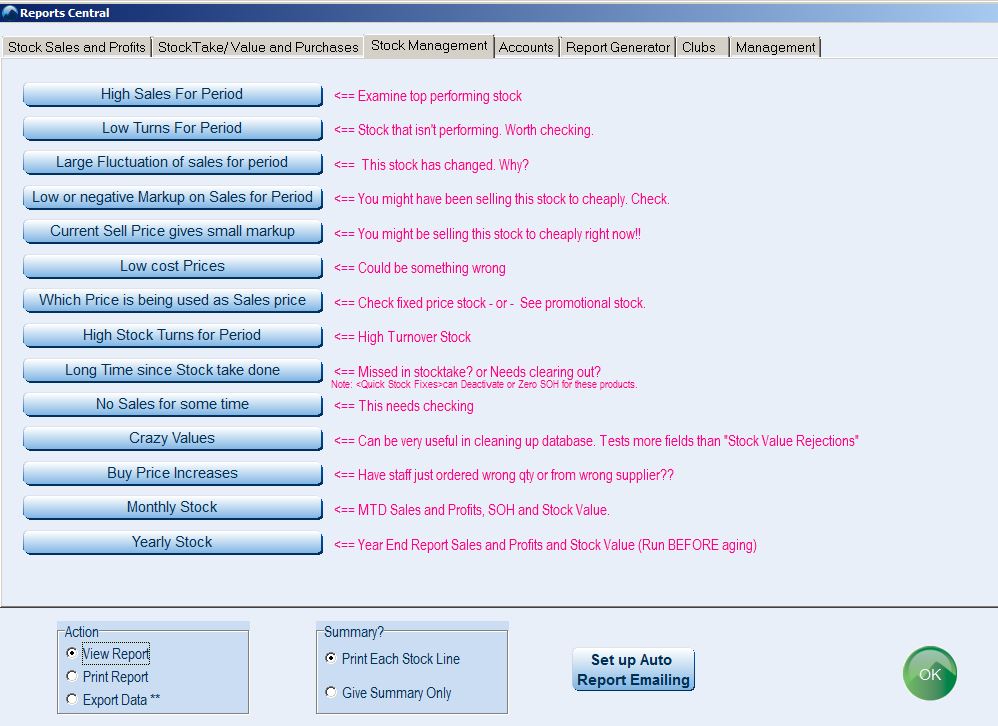
One can run some helpful reports on stock performance, including a Low Turns For Period report by going to Reports > Reports Central > Stock Management tab. In pink we note what the reports might be useful for.
A particularly powerful report is the Customised Profit report, which can be found in the Stock Sales and Profits tab in Order Central.
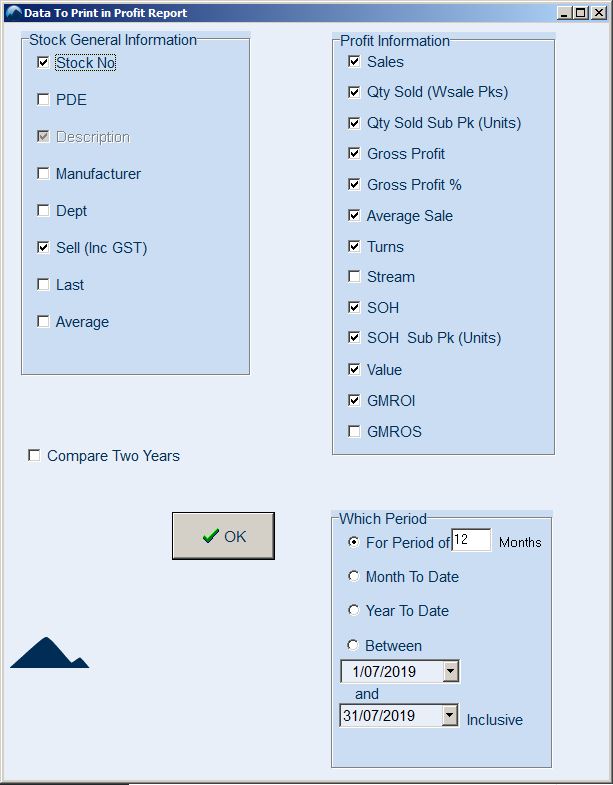
After sorting and filtering the report, we can choose to include a number of columns which include information like the GMROI, profit, and turns.
In the lower right are options for which time period you want the report for.
A particularly useful report for a regular check up on your OTC lines is the Low or negative Markup on Sales for Period report which lives in Reports > Reports Central > Stock Sales and Profits tab. This should be checked monthly and allows the user to specify listings of any items which have been sold at a poor profit. For example, you might tell the system to list lines that have been sold below a 20% markup. Lines that appear here might appear because they have been sold on discount, or are on promotion, which would be expected. However lines which show up unexpectedly could indicate that retail prices aren’t being updated and maintained regularly, or that costs have increased due to poor buying from a wholesaler.
Another aspect of performance is performance of your staff (which requires the use of clerk codes to be useful).
These reports can be automatically generated each day, week or month, or can be printed ad-hoc from Reports > Reports Central > Management tab.
When we log sales quantities against clerks, we do not include dispensary sales, with the idea being that we’re only logging quantities for sales where the staff member would have had some opportunity to help make the sale/ cross sell/ upsell, which obviously isn’t the case with dispensary lines.
We do not log basket size or provide metrics as for Pharmacy this metric isn’t useful (where it might be in other industries). This is also due to the fact that many pharmacy sales are dispensary and therefore the basket size is largely outside the control of pharmacy staff.
Instead one should compare time statistics (when customers are in) against clerk quantities and sales amounts, in order to determine the staff making the most effective sales.
Additionally we are the only POS vendor in the industry to offer a wireless till option, which lets you make sales at the shelf with the customer. Your staff can then spend time making cross sales and up sells with the customer, which we’ve found is a very effective method for boosting sales and also improving customer satisfaction, as your staff are given the opportunity to demonstrate their knowledge of the products you stock.